
Visibility Across Every Language You Support.
Language IO’s reporting and analytics dashboards give you the visibility to run multilingual support like a business, not a best guess.


Set Your Goals. Track Them. Actually Know if You’re Hitting Them.
Most enterprise support teams track performance in aggregate. One number. One story. The problem is that number hides everything that matters in a multilingual operation. Which language queues are overwhelmed on Mondays. Which markets are churning quietly because resolution quality is not what it is in English. Which translation engines are working and which ones are costing you retranslation requests.
Language IO lets you define what good looks like for your multilingual operation and measure against it over time. Set targets for ticket volume, CSAT by language, resolution time, or retranslation rates. Track progress in a single view. Stop finding out about performance gaps in quarterly business reviews.
The Patterns Your Aggregate Data Has Been Hiding
Your busiest support day is Tuesday. But is that true in Japanese? In Portuguese? In German? Language IO breaks ticket volume down by language so you can see demand patterns the way your customers actually generate them. Which languages spike on which days. How volume shifts across markets as time zones move through the day. Where your staffing model is a mismatch for the load you are actually carrying.
Alongside volume, you get CSAT tracked by language. Not rolled up. Not averaged out. By language, so you can see exactly where your customer experience holds up and where it does not.
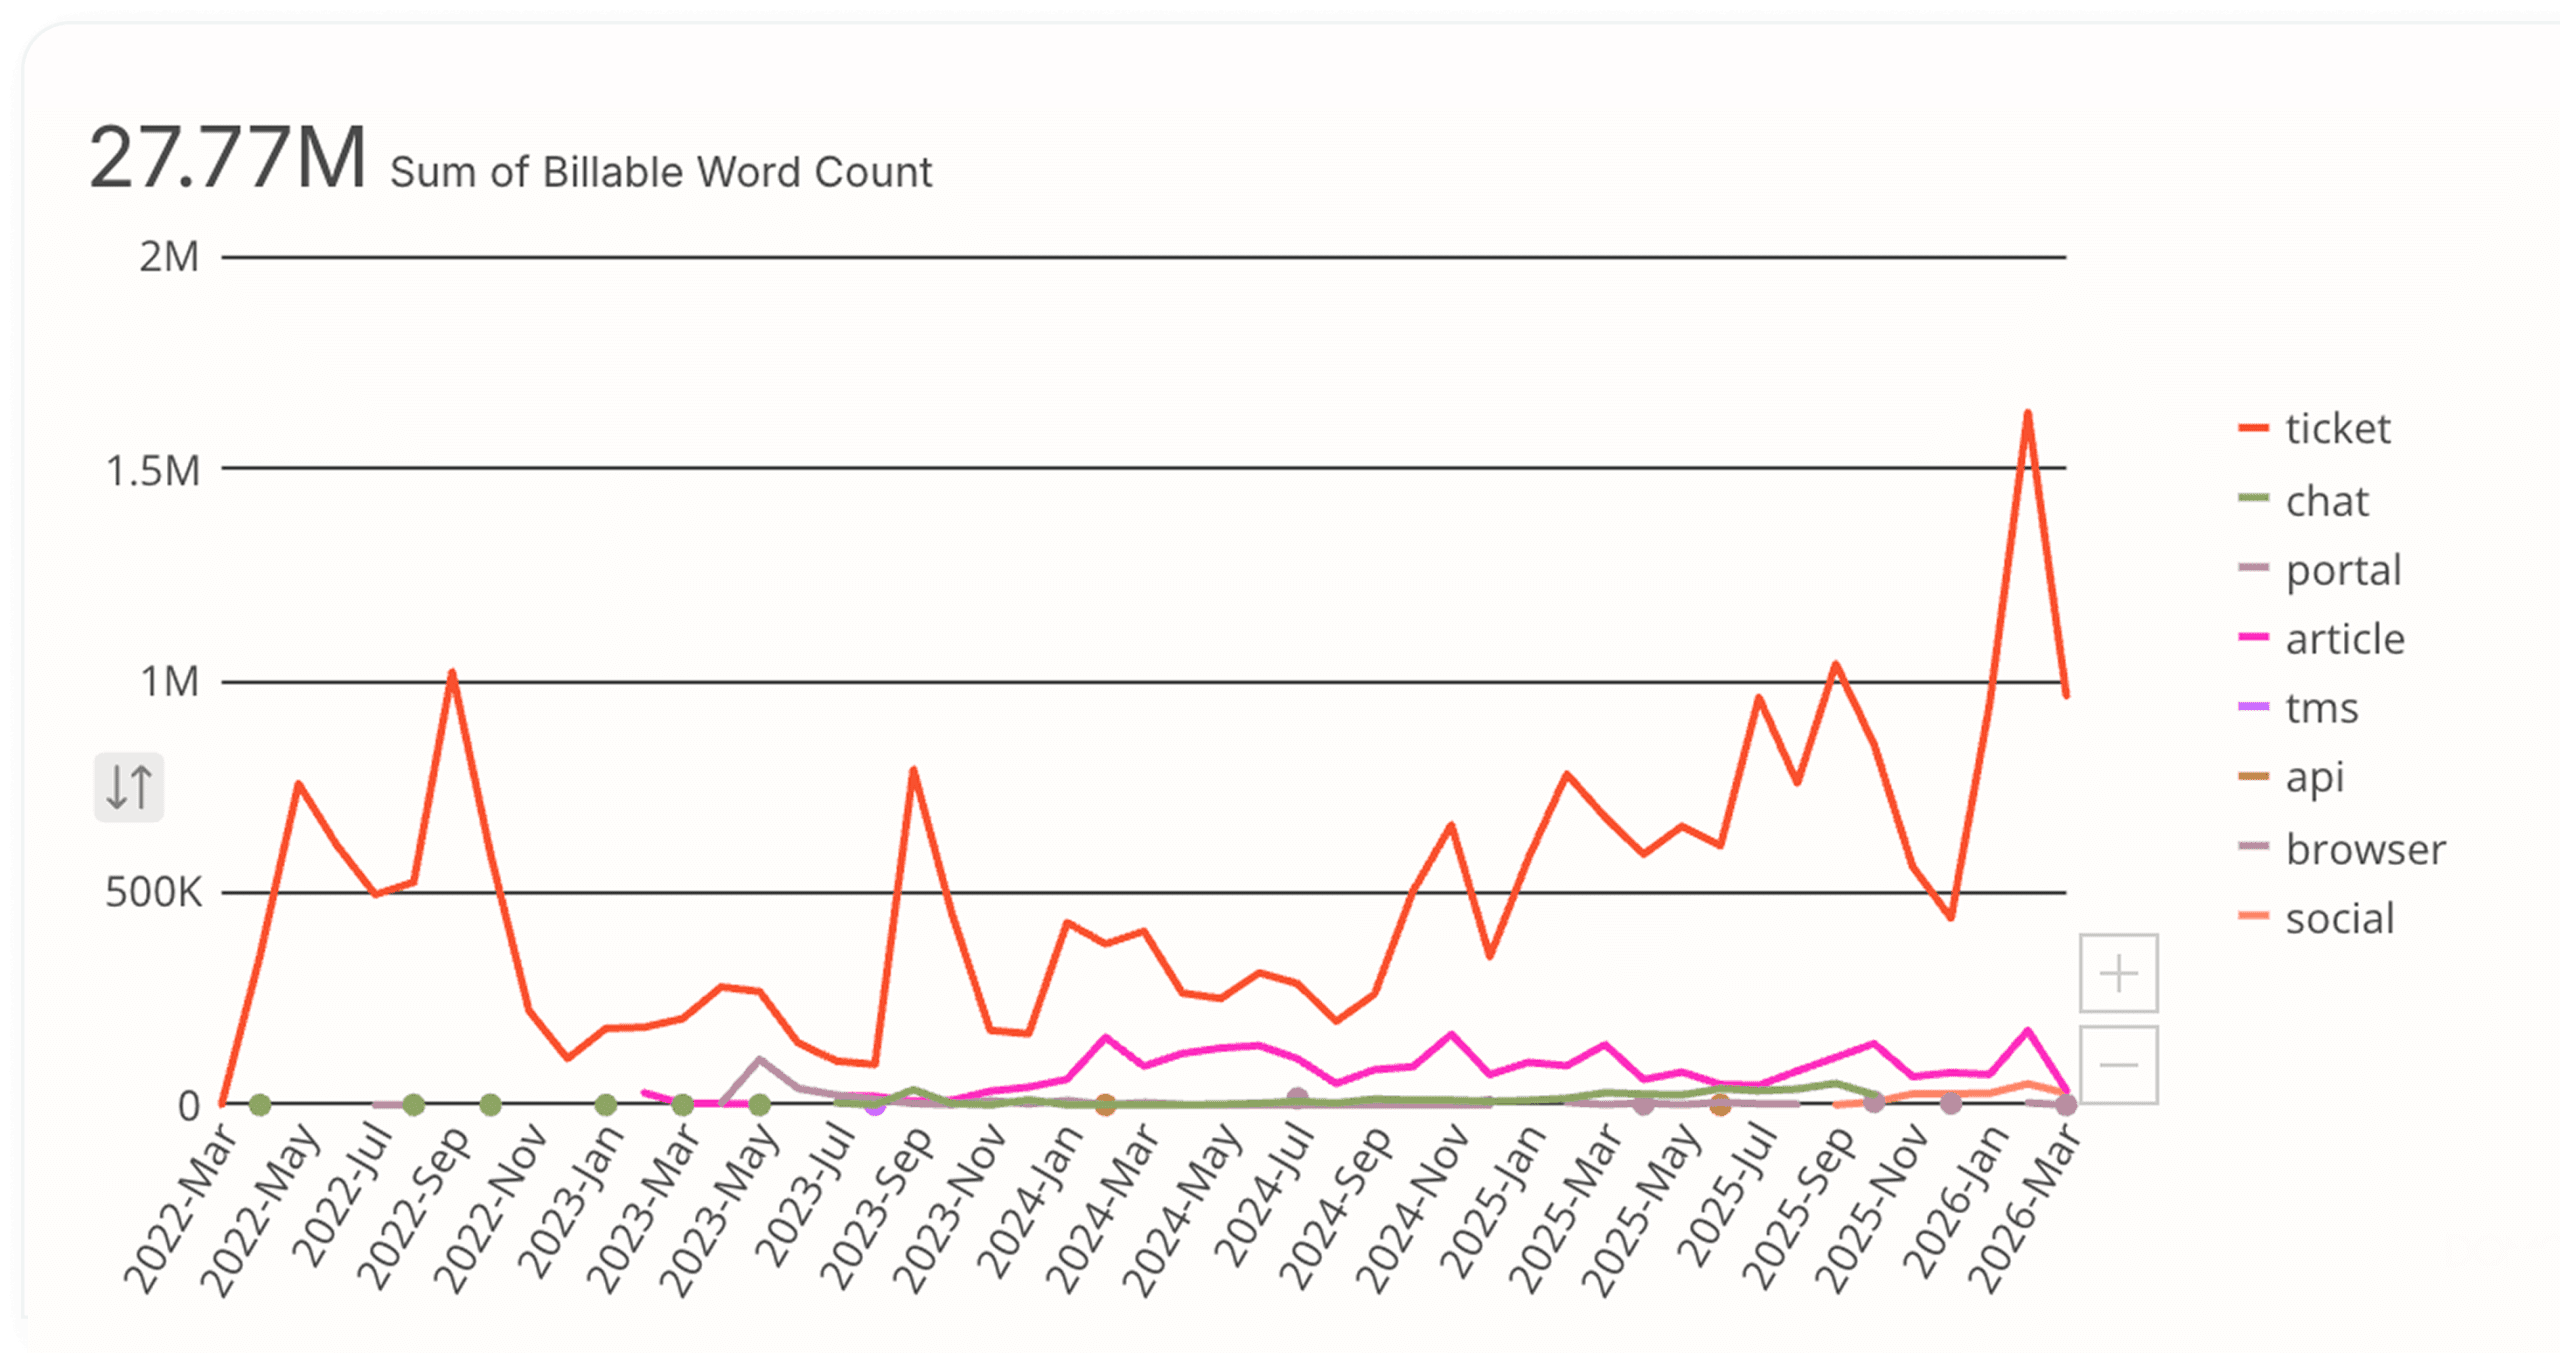
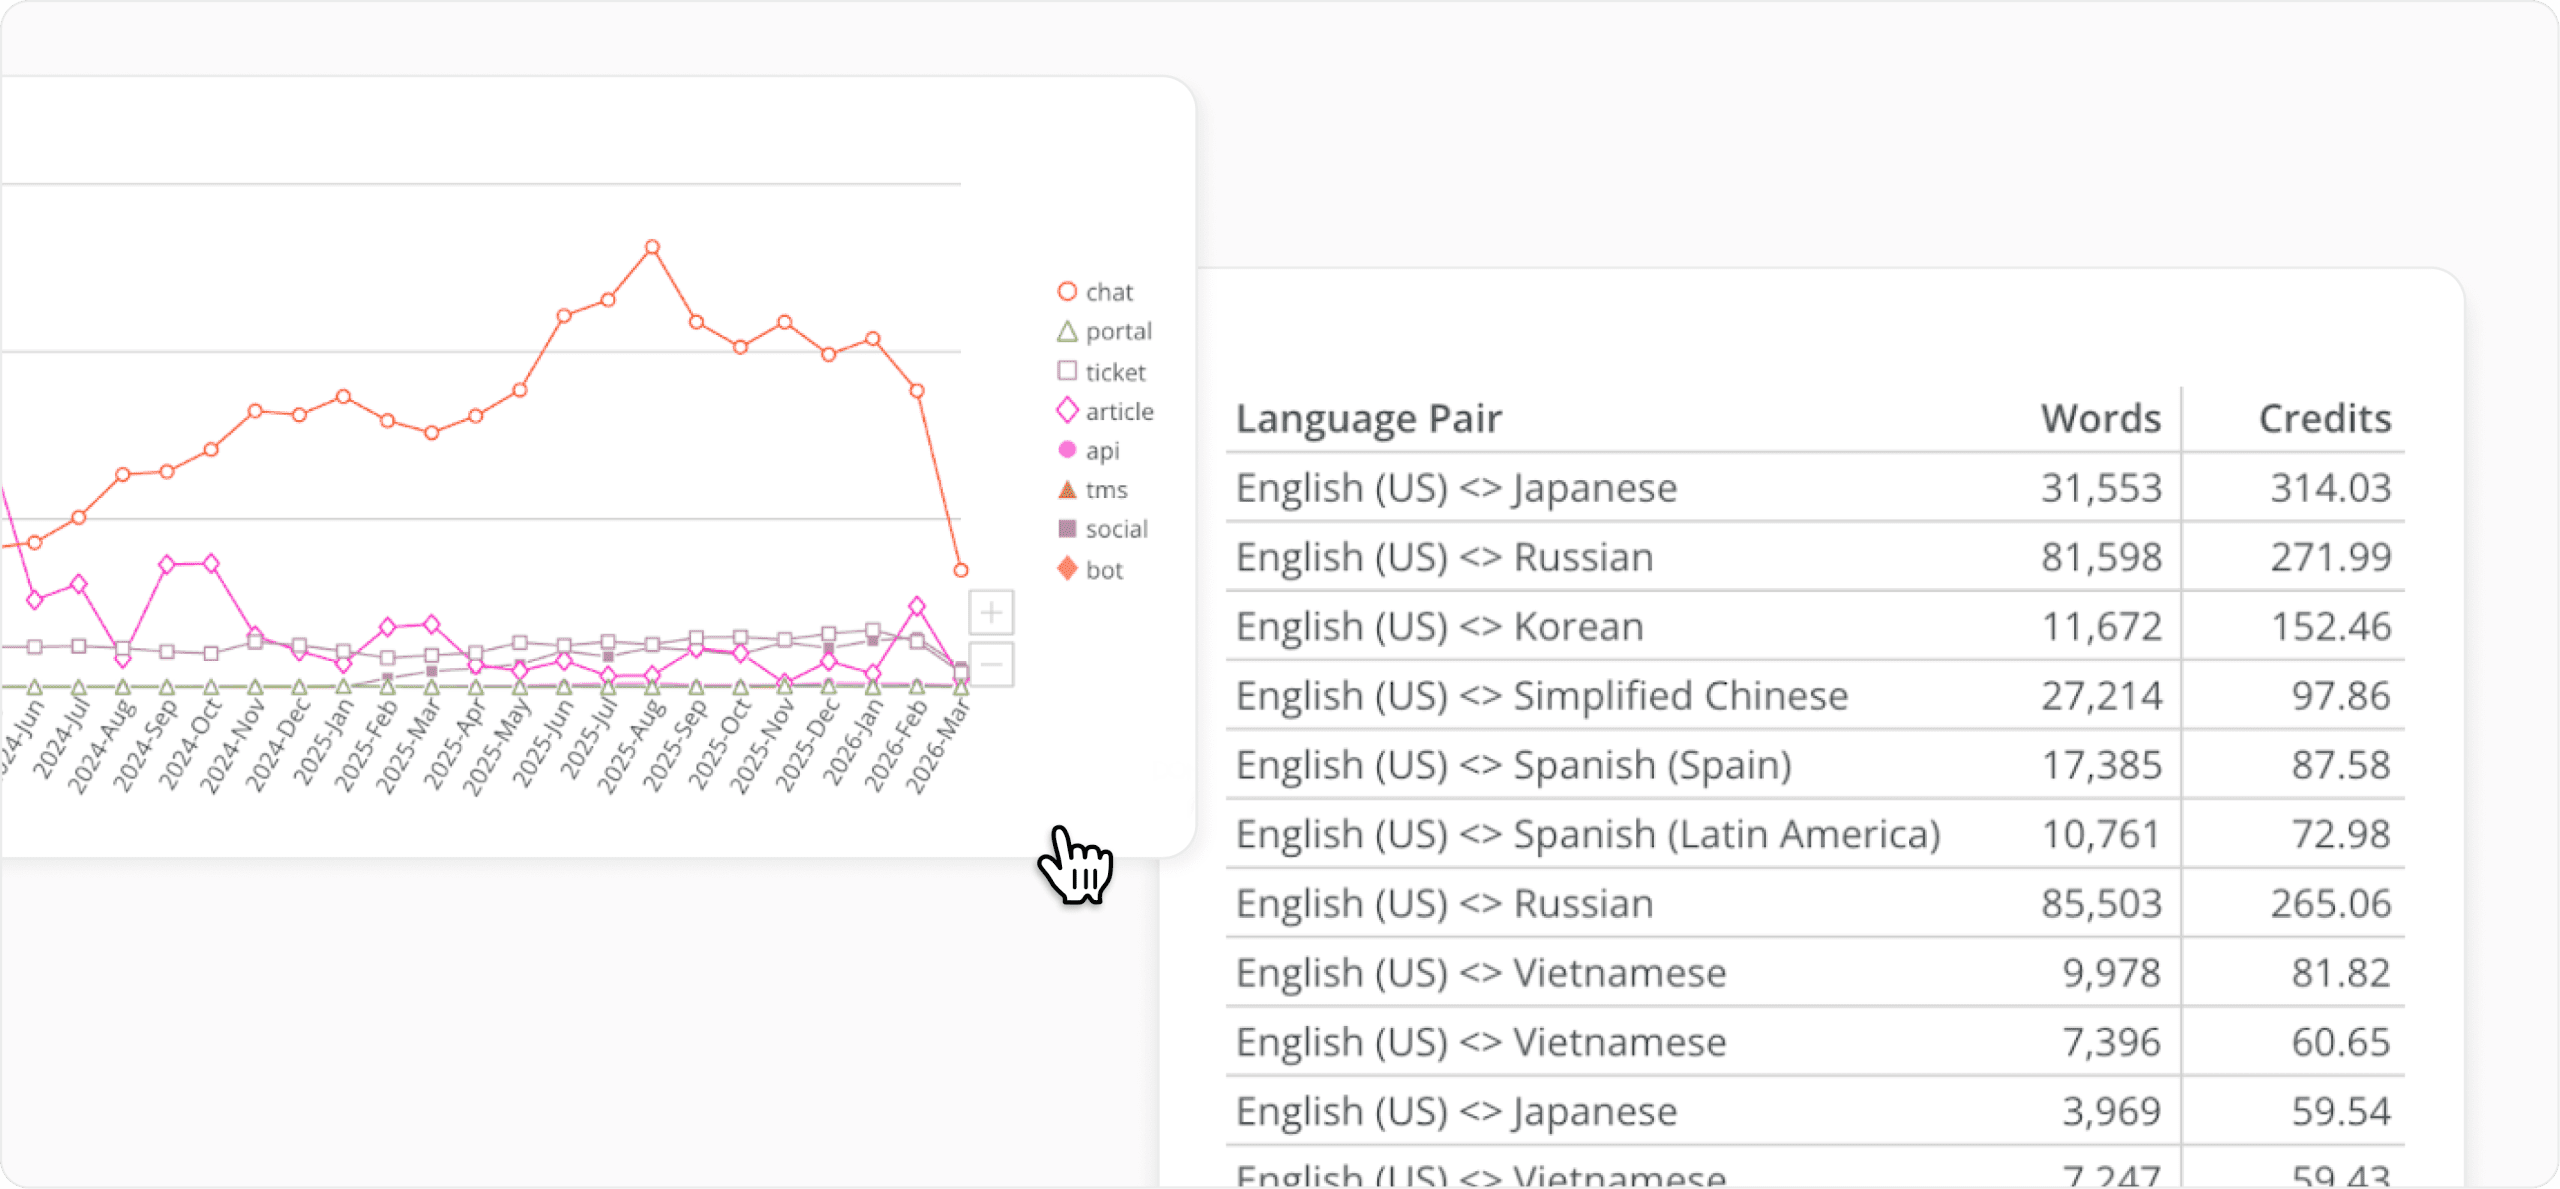
Reporting by Channel
Words translated by channel / by month
Your Data Belongs in Your Tools
Language IO reporting is built to move. Export any dataset to CSV and take it wherever your analytics team works. Tableau. Excel. Whatever your stack looks like. Pivot it, model it, build on it. The data is yours and it should work the way your business works. Every chart in the dashboard can be exported directly and dropped into a presentation. No screenshots. No reformatting. You pull the insight, you share it.

Enterprise Business Intelligence Tools
- Tableau
- Microsoft Power BI
- Looker (Google)
- Qlik

Spreadsheets and Accessible Analytics
- Microsoft Excel
- Google Sheets
Data Warehouse and Advanced Analytics
- Salesforce Analytics / Einstein
- Snowflake
- Databricks

Customer Experience
- Zendesk Explore
- Salesforce Reports
- ServiceNow Performance Analytics

Language Pair Intelligence, Not Just Language
There is a difference between knowing you handle Spanish support and knowing how your Spanish-English interactions perform versus your Spanish-French ones. Language IO breaks performance down by language pair, giving you the granular view that aggregate language reporting misses. This matters more than it sounds.
A quality problem in one pair does not mean a quality problem across the language. You need to see at the pair level to fix at the pair level.
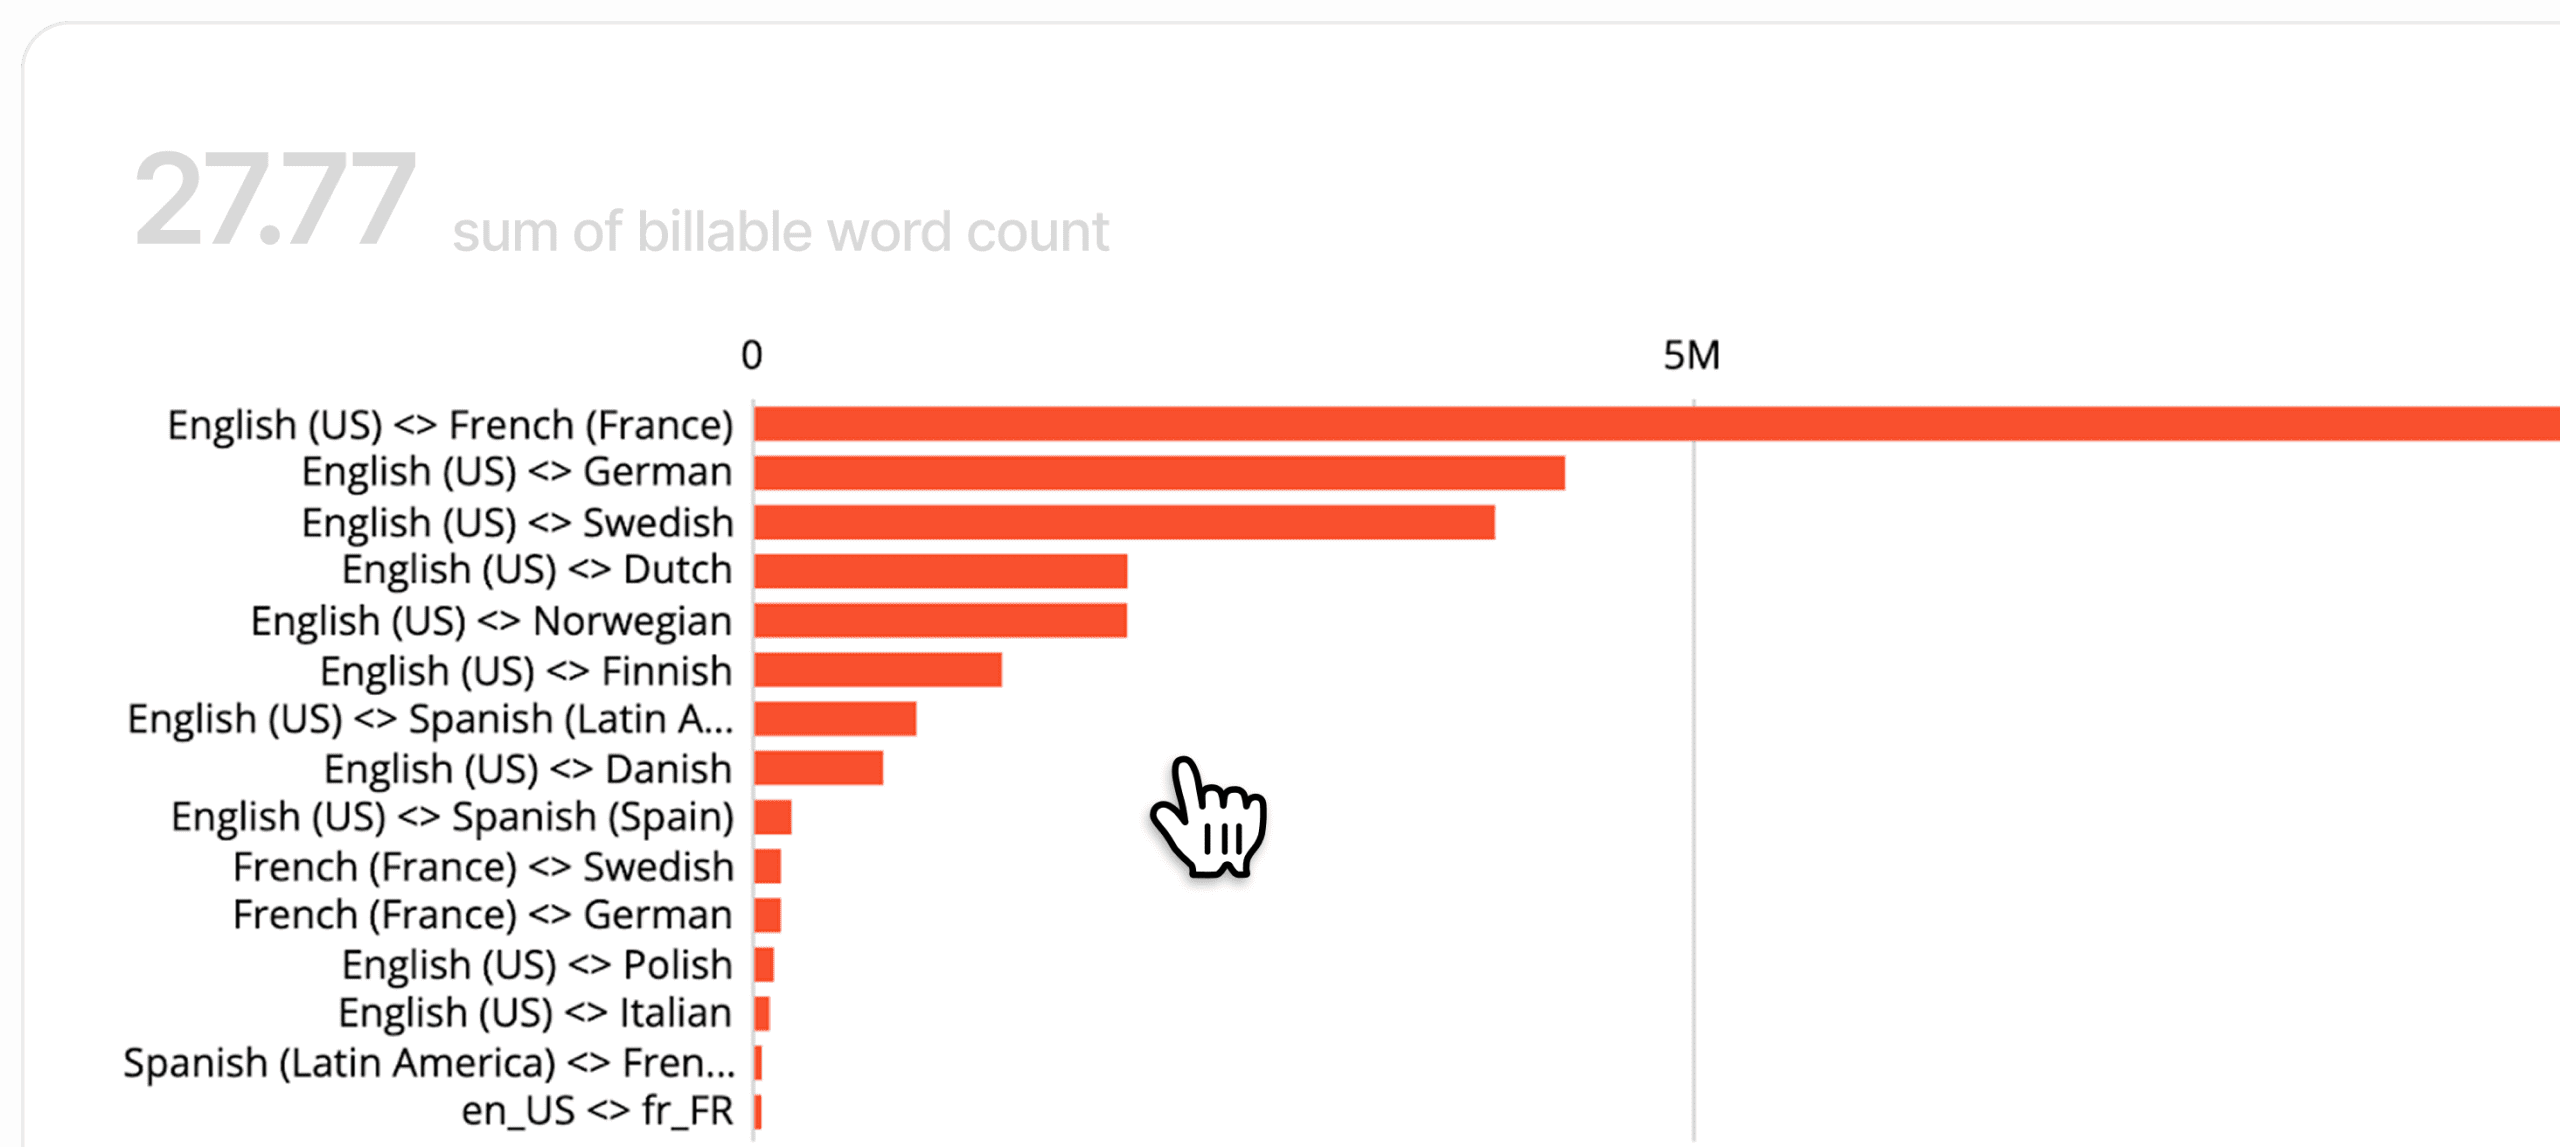
Reporting by Language Pair
Words translated by language pair
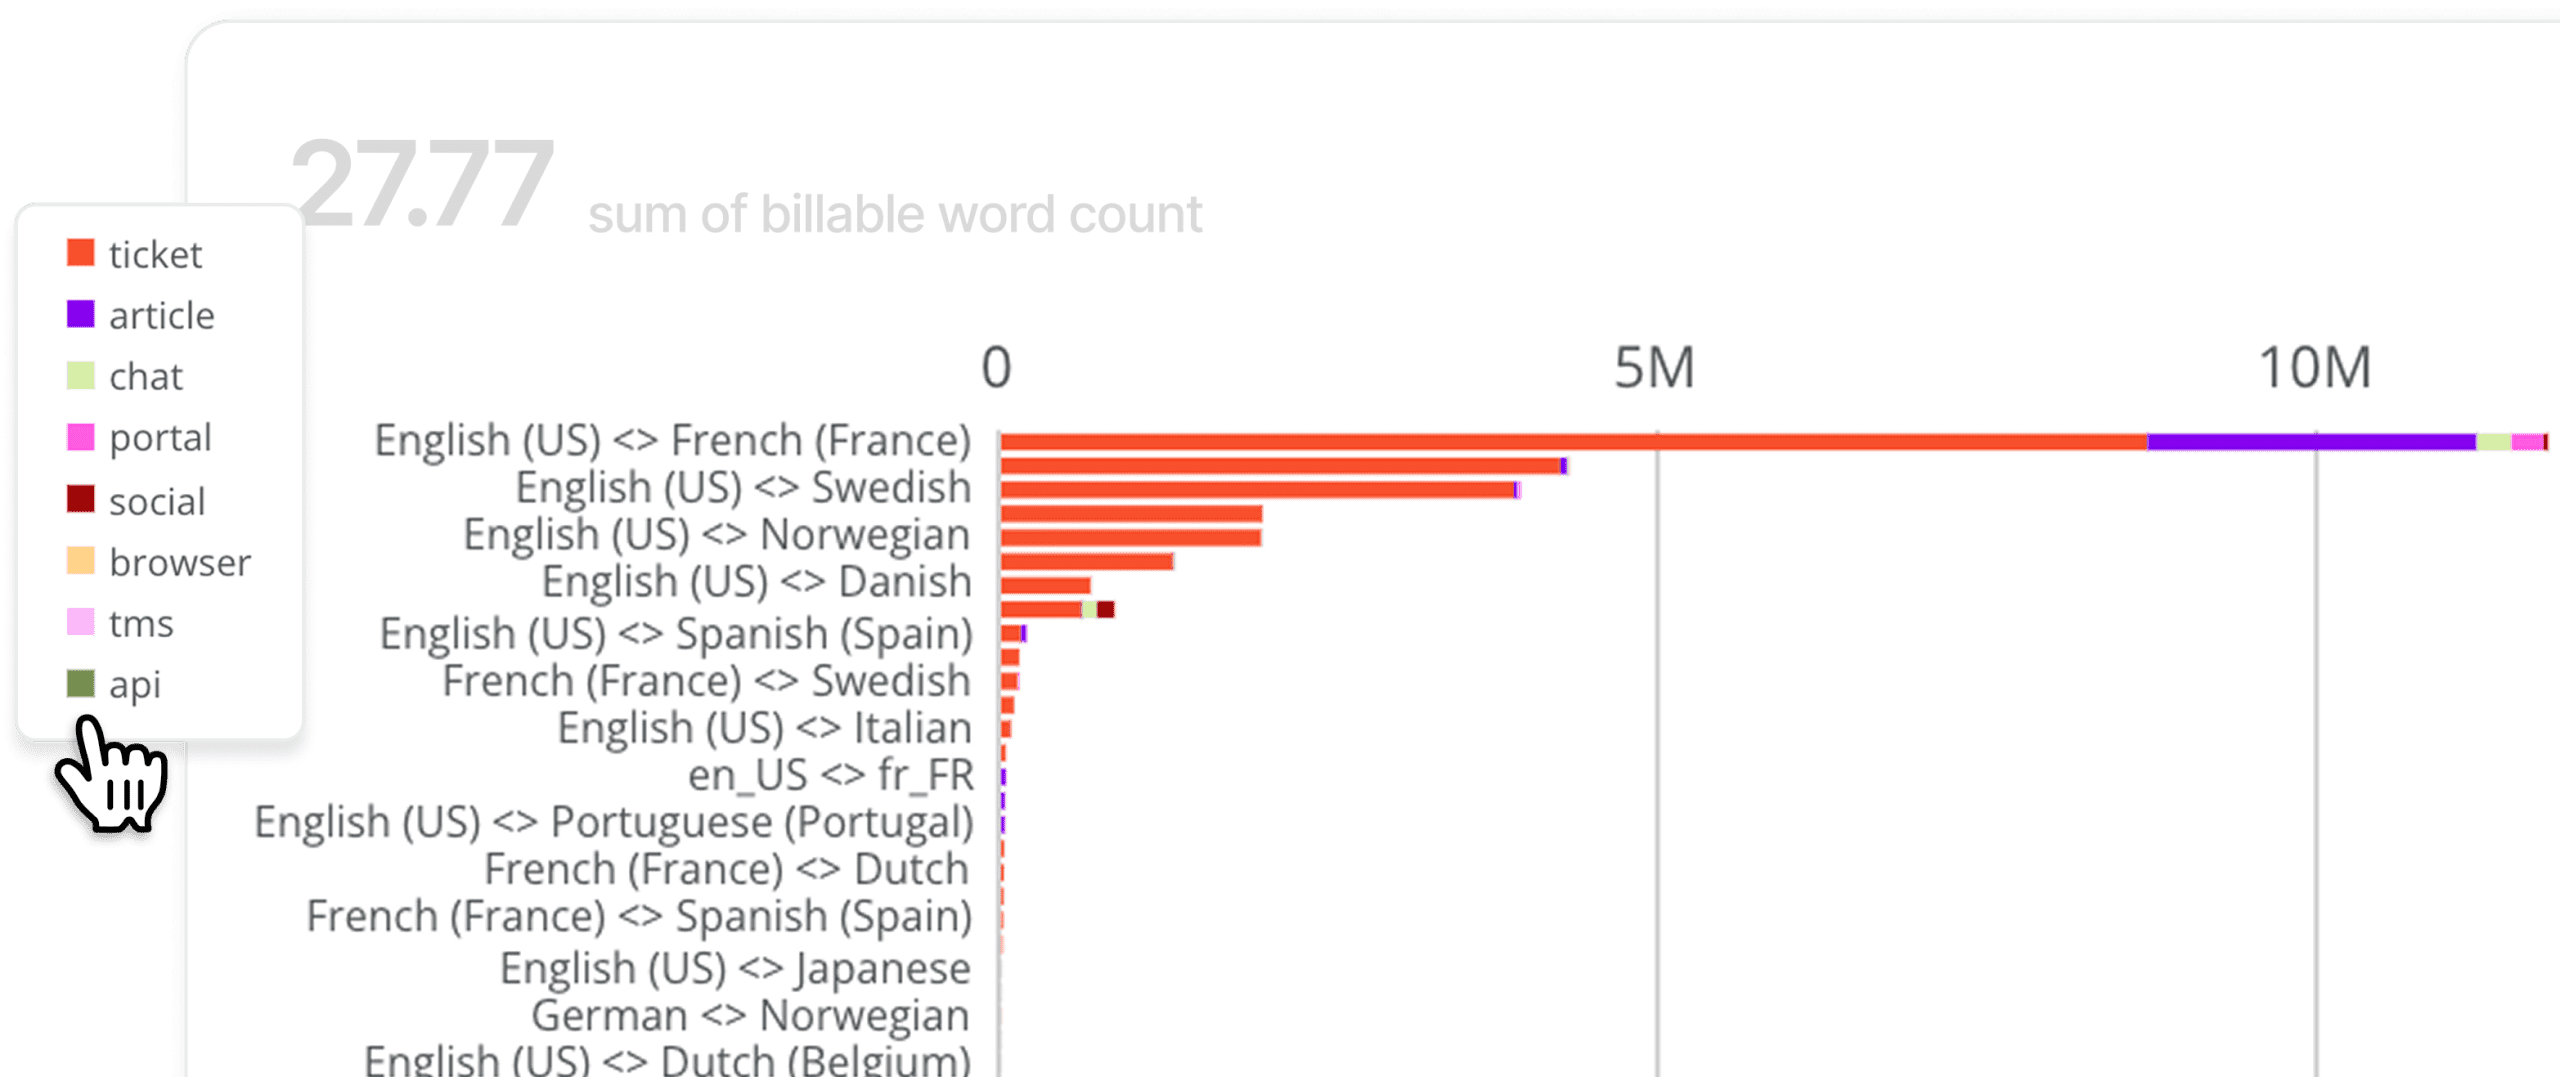
Reporting by Language Pair and Channel
Words translated by language pair and channel
Know What You Are Spending.
Know What You Are Getting.
Language IO tracks credit usage in real time so you always know where you are against your allocation. No surprises at the end of the billing period. No guesswork about which activity is drawing down your balance. Usage is broken out clearly so your team can see exactly what is driving consumption and plan accordingly.
The Right Engine for Every Language Pair
Not all translation engines are equal across all language pairs. Papago, for example, outperforms other engines on Asian languages. Language IO already knows this, and routes accordingly. But you can see it too.
The priority engine dashboard shows which engines are being used across your language pairs and how frequently. If you want to understand what is running under the hood or validate that your configuration is optimized, it is all there.
Quality You Can Actually Measure
Retranslation requests tell you something. Retranslation flags tell you more. Language IO’s quality dashboard surfaces both, so you can see not just how often customers or agents are asking for a better translation, but where those requests are concentrated.
High retranslation rates in a specific language pair point to an engine configuration issue. High rates on a specific content type point to a training gap. The dashboard gives you the data to diagnose the problem, not just observe it.